Dashboards
Overview
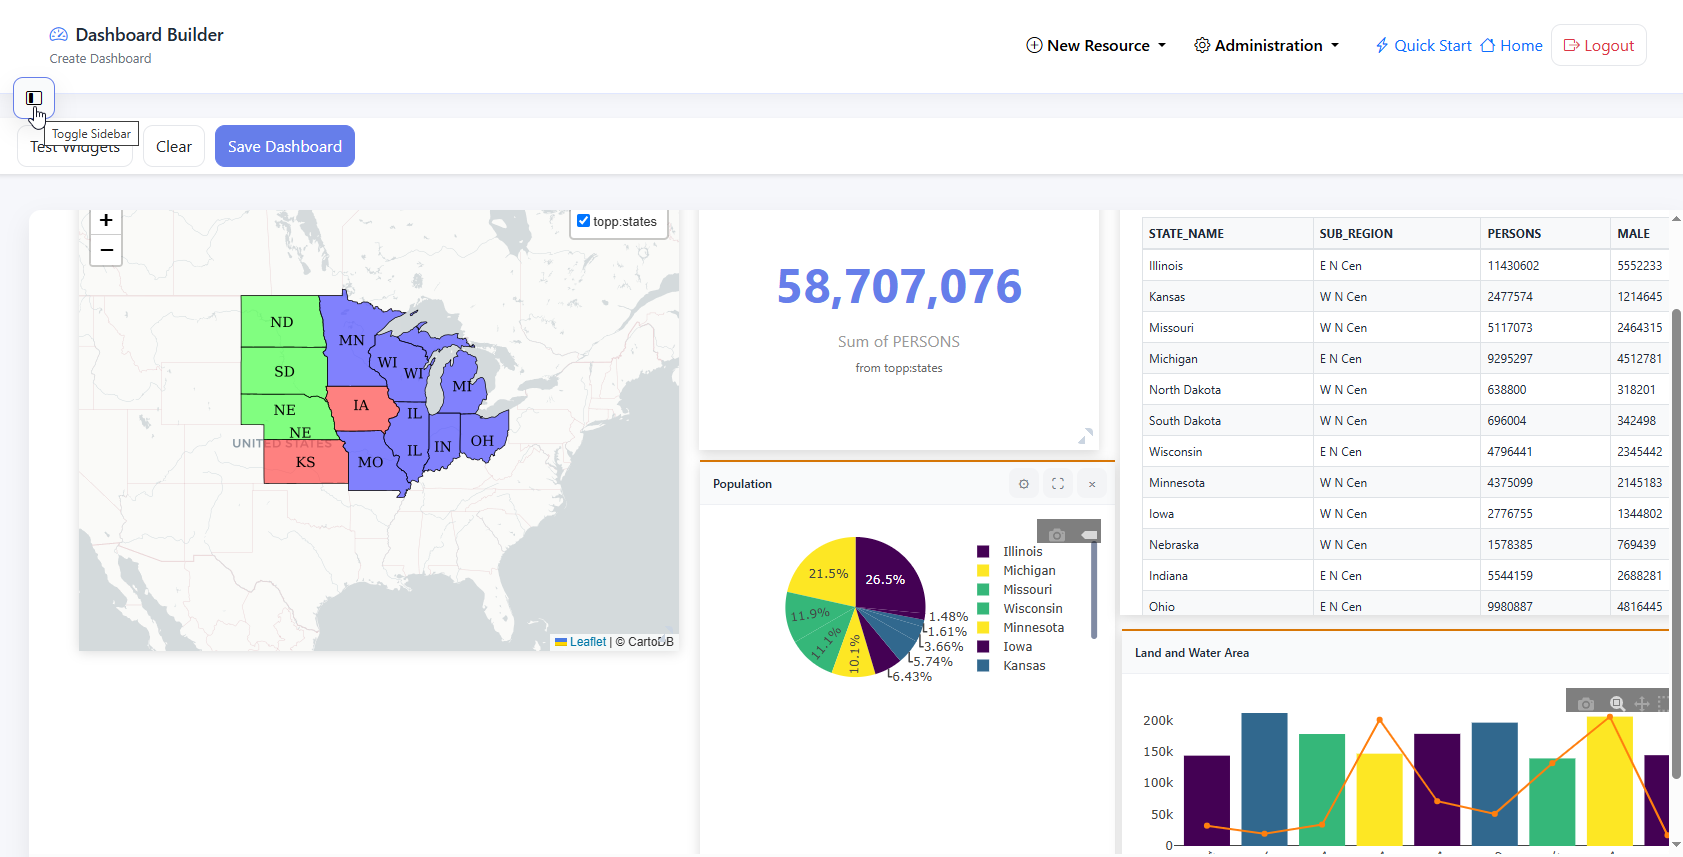
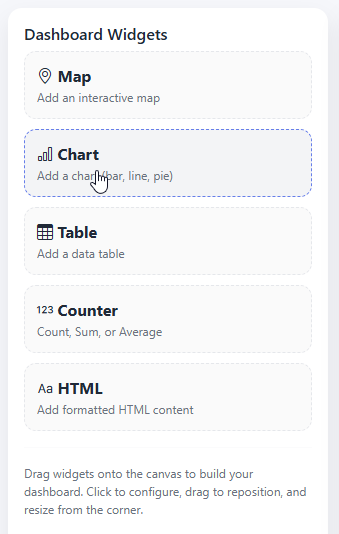
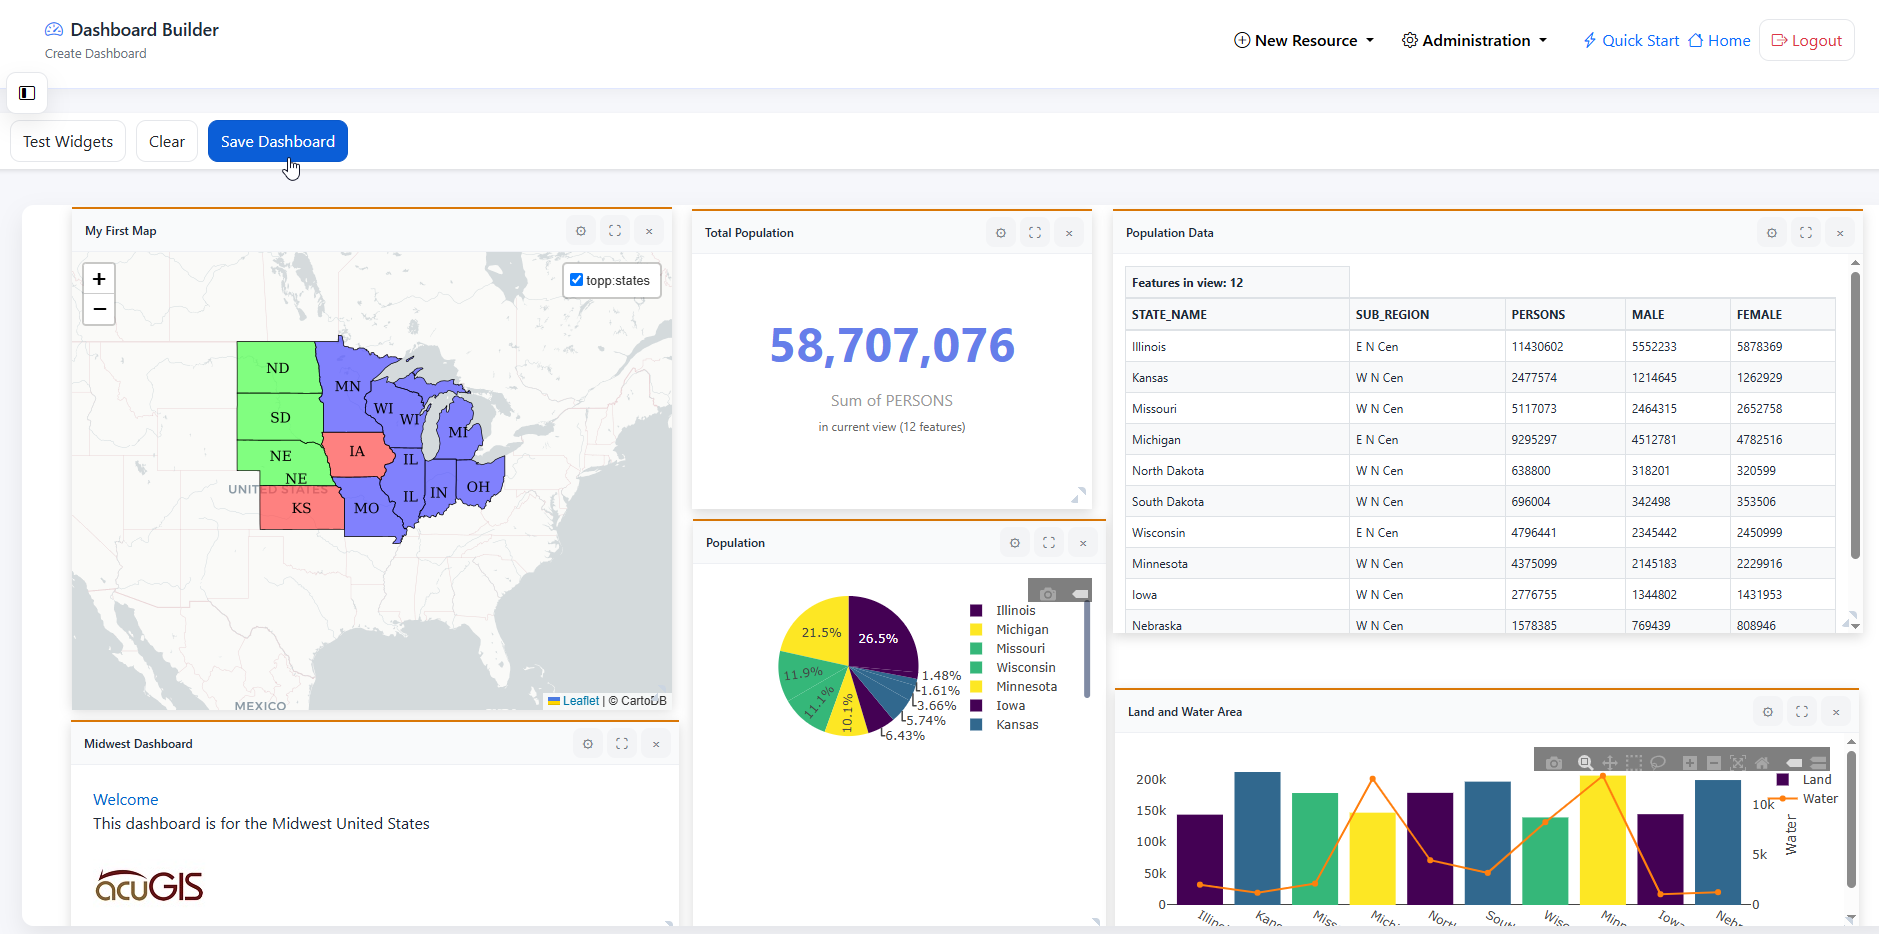
Dashboards contain a Map widget along with Chart, Table, Counter, and HTML widgets.
When creating a Dashboard, be sure to use the Toggle function in order to see full width
Create Dashboard
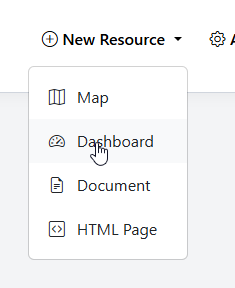
To add a new Map, go to Add Resource > Dashboard
Map Widget
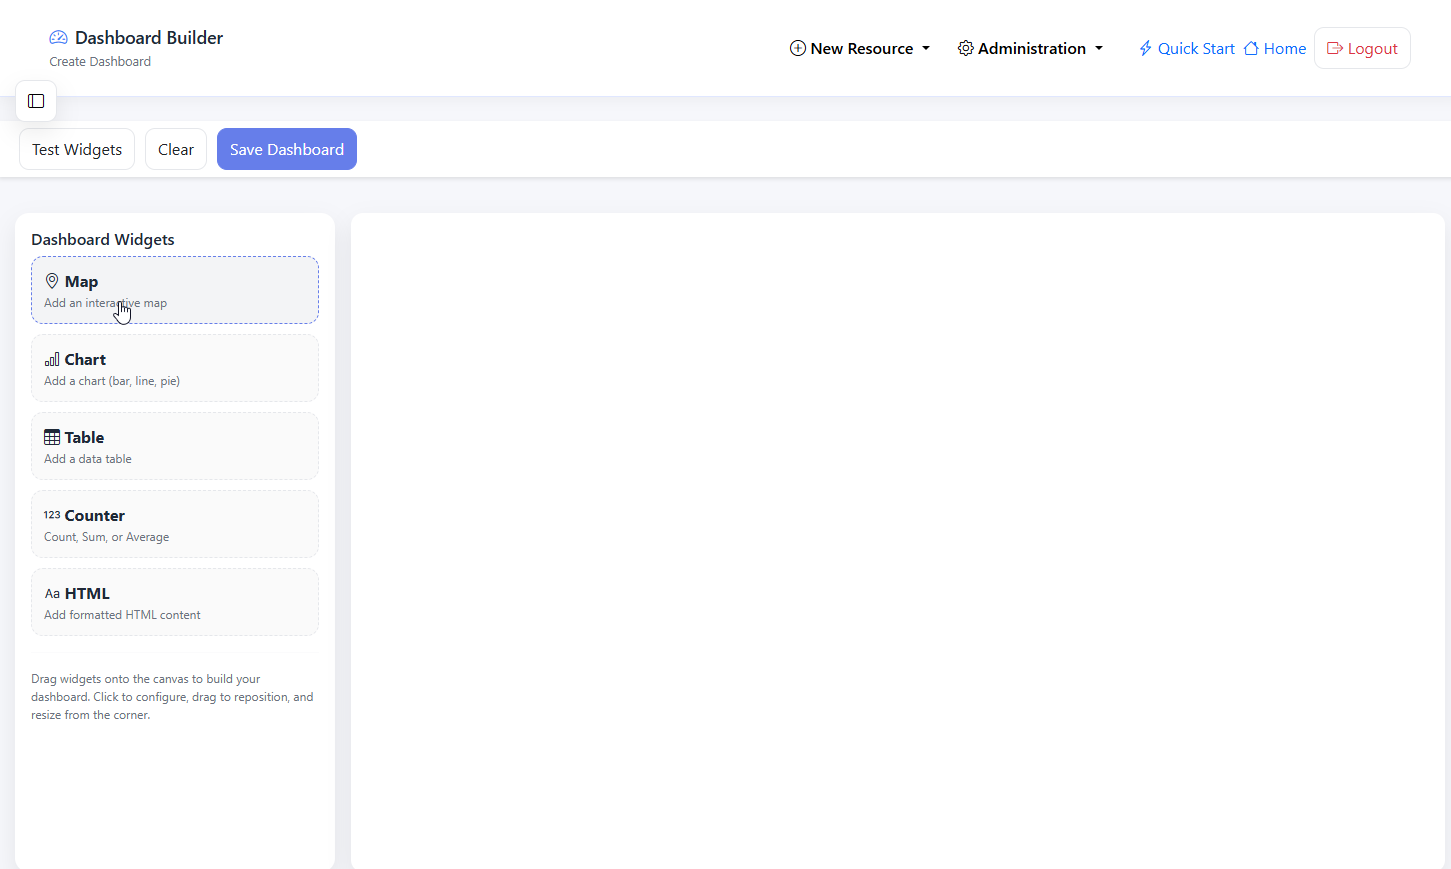
Click on Map to add a Map widget
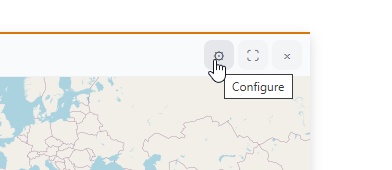
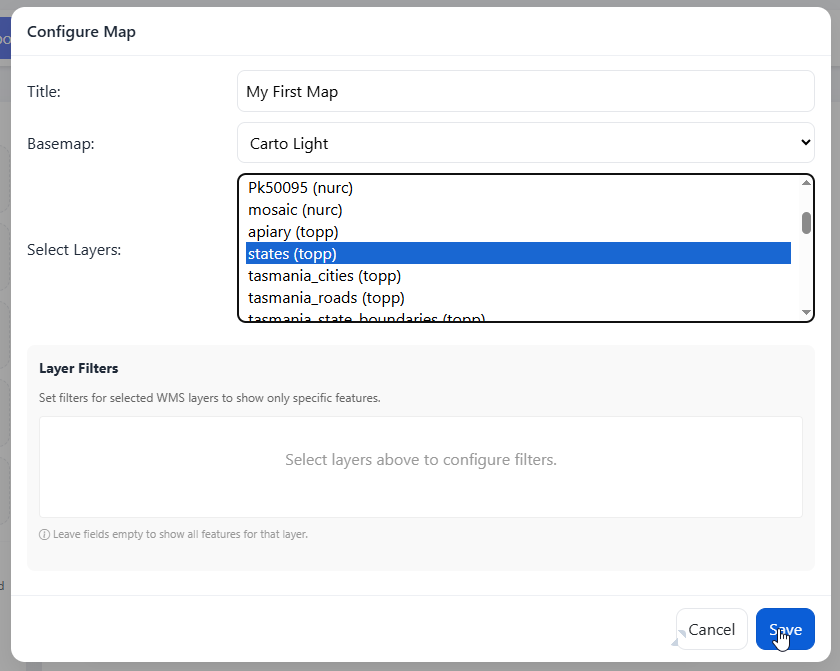
Click the Configure button
Give your map a Title, select a basemap, and select the Layer(s) you wish to use
Click Save
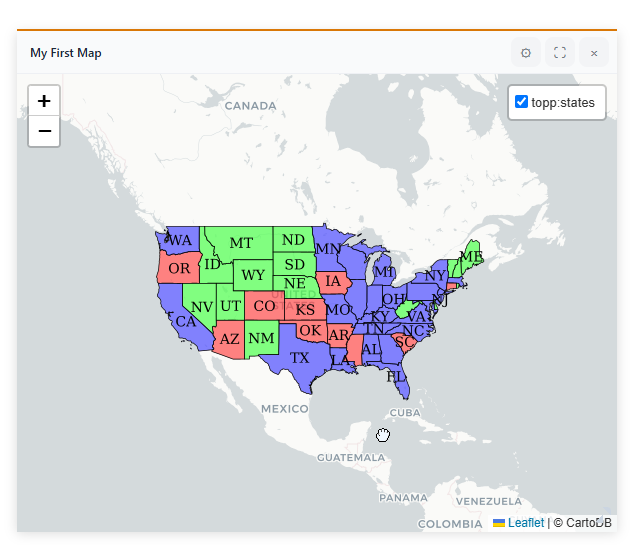
Position your map to where you would like it on page load
If you wish to add Filters to map, click Configure.
Add any Filters you wish to add.
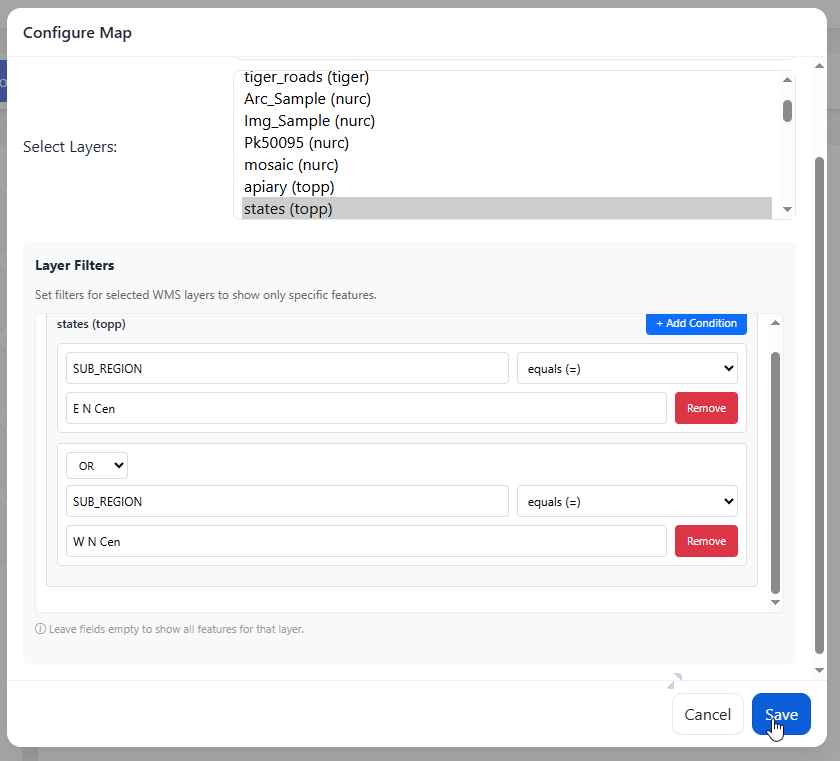
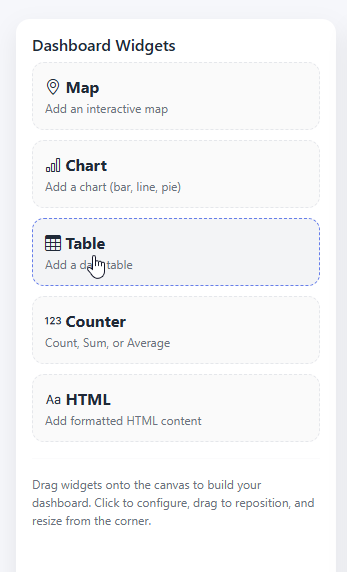
Chart Widget
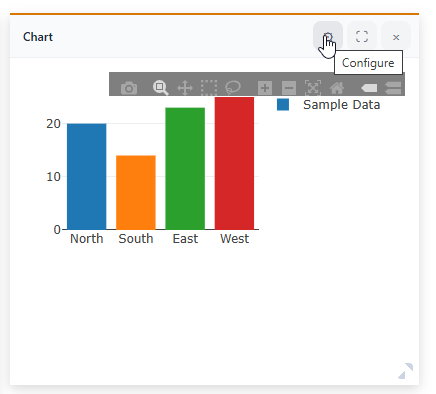
Click Chart to add a Chart widget
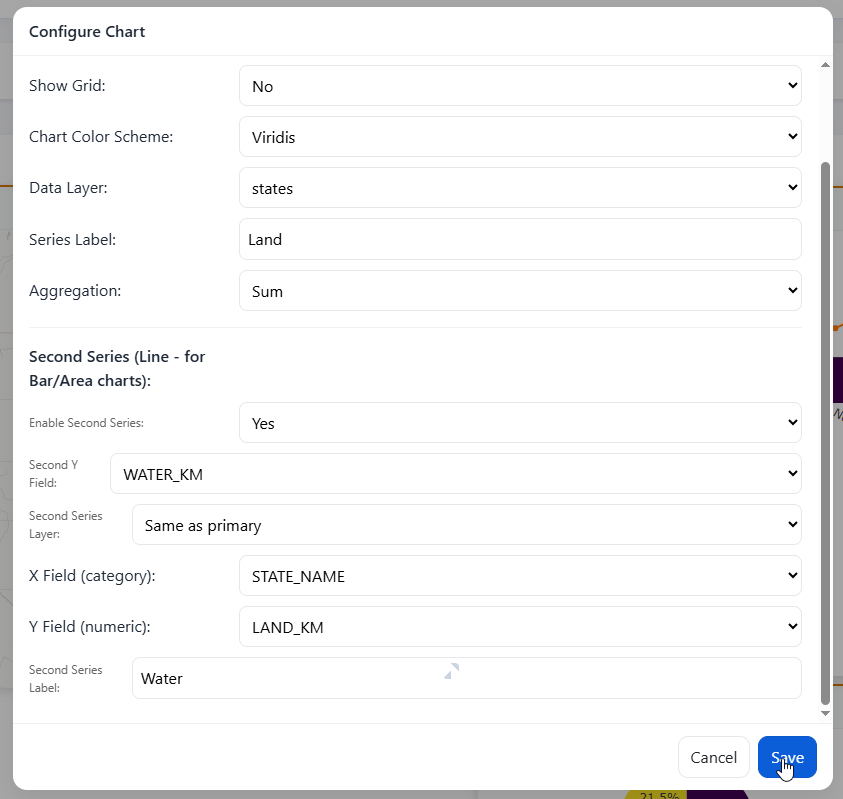
Click the configure button
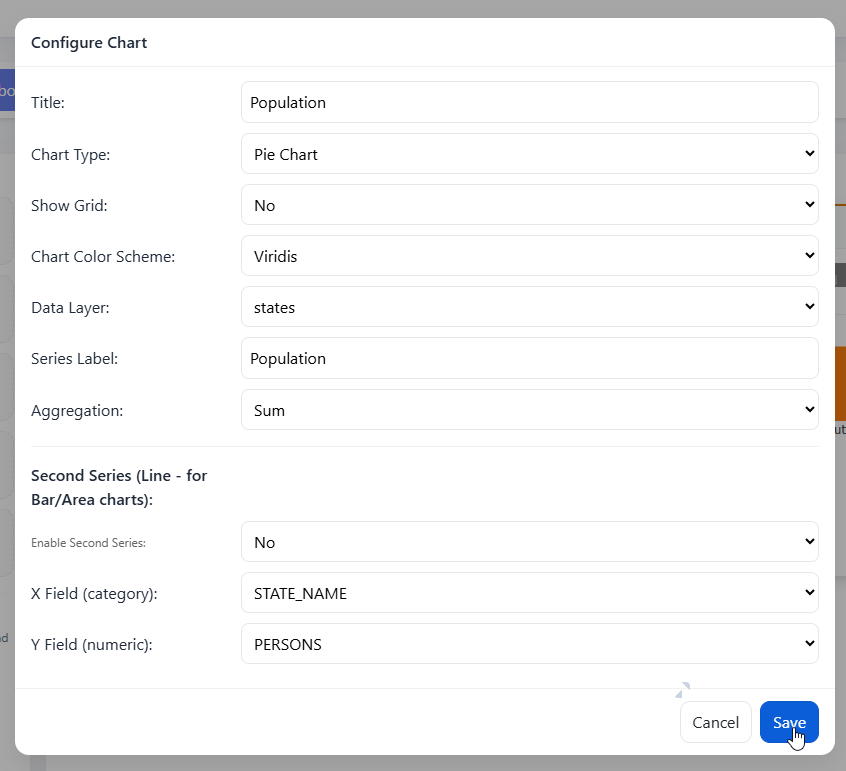
Select/Enter the following value:
Title
Chart Type
Show Grid
Chart Color Scheme
Data Layer (GeoServer Layer)
Series Label
Aggragation (Sum, Count)
Enable Second Series
X Value
Y Value
Click Save
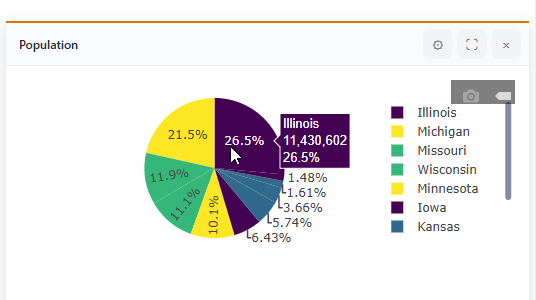
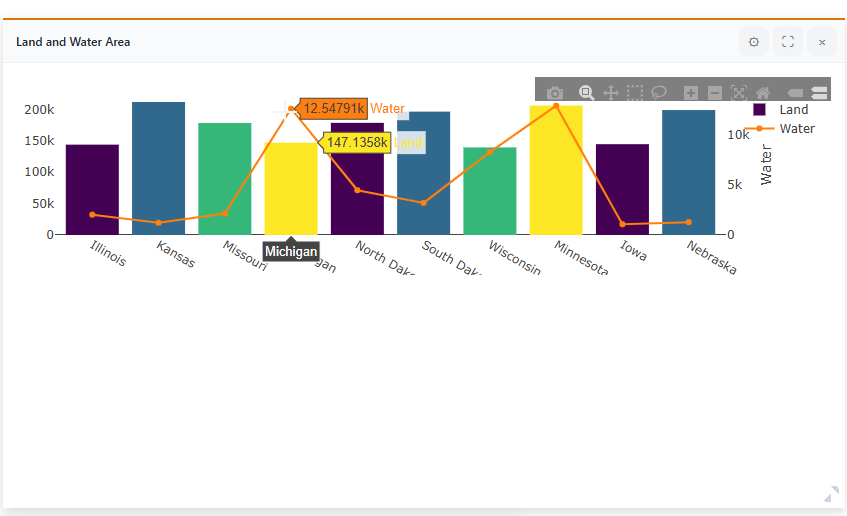
The Chart has now been created
To add a Second Series, set Enable Second Series to Yes (Only for Bar and Area Charts)
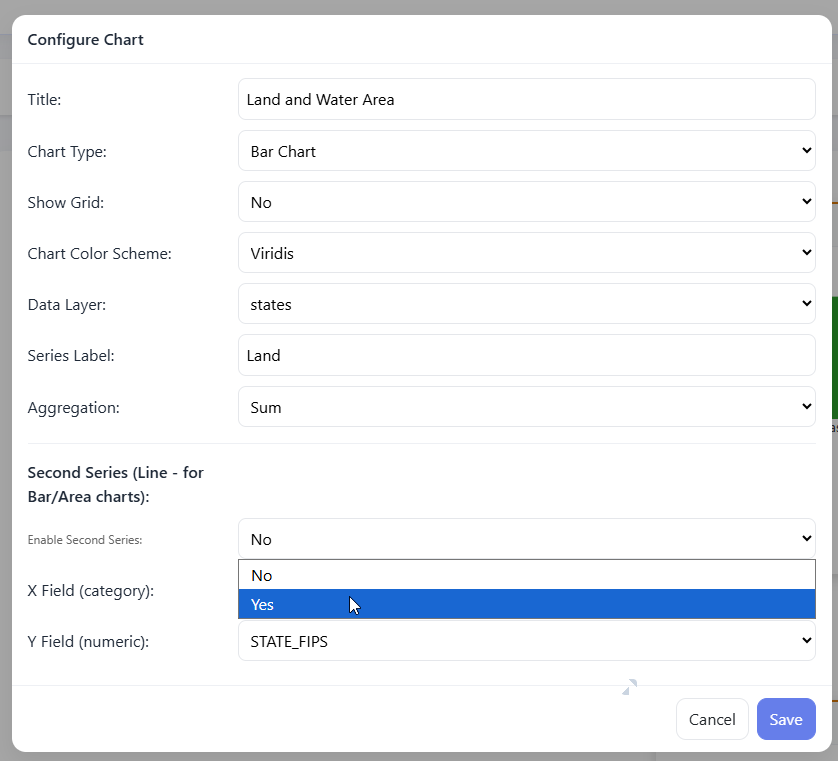
Select Second Series X and Y and label
The Chart has now been created.
Data Tables
Click on the Table widget
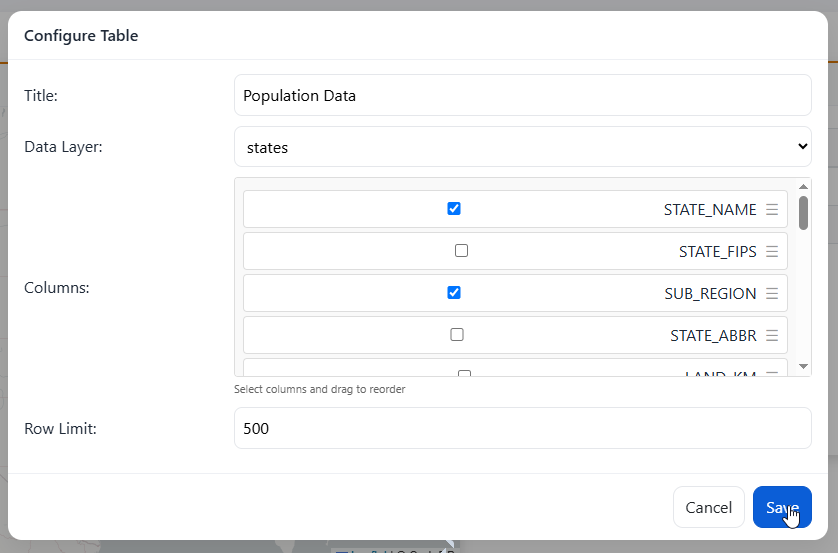
Click the configure button
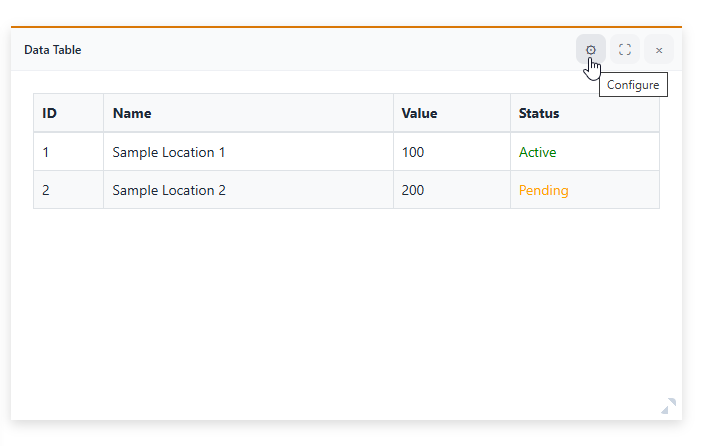
Enter a title, and select data layer and column(s)
Note that column order can be set by dragging columns up or down
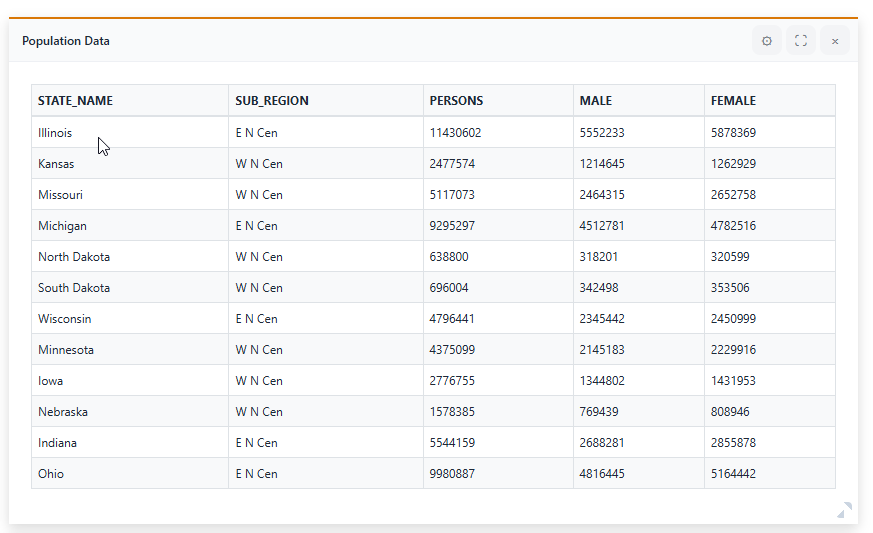
Data Tabls has been created
Counter
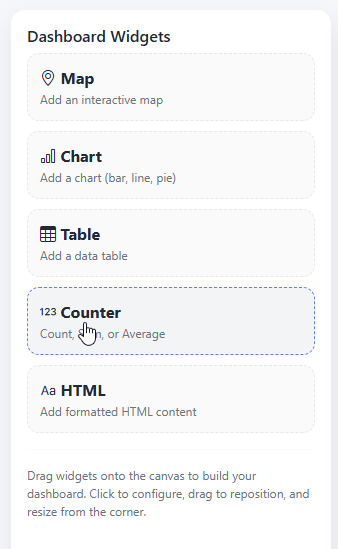
Click the Counter widet
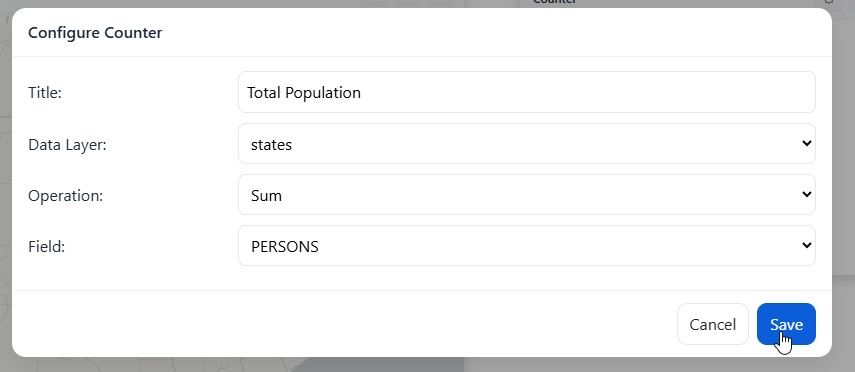
Click the Configure button
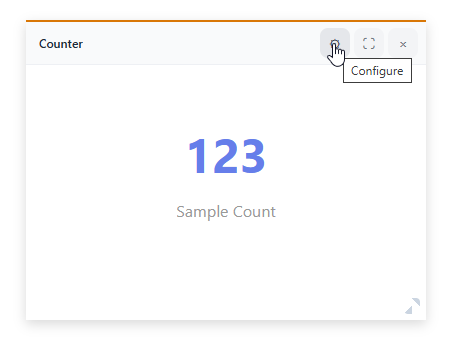
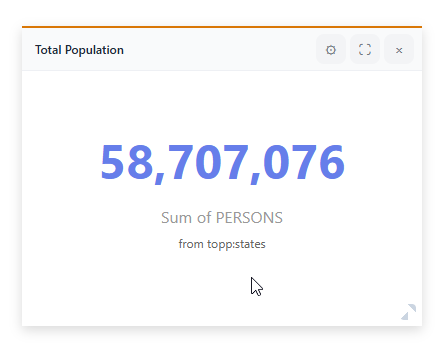
Enter a title, select a data layer and operation (Count, Sum, etc..) and Field
The Counter has been added
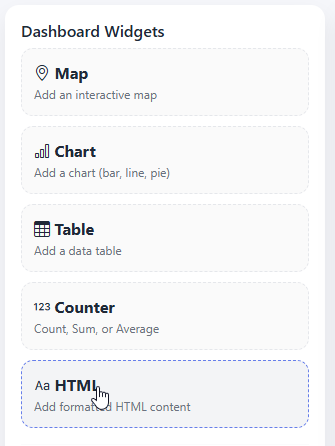
HTML
Click on the HTML widget
Click the Configure button
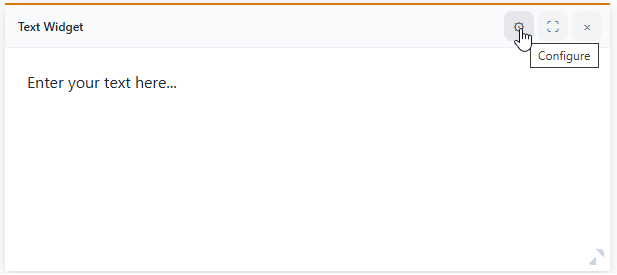
Add and style your HTML content
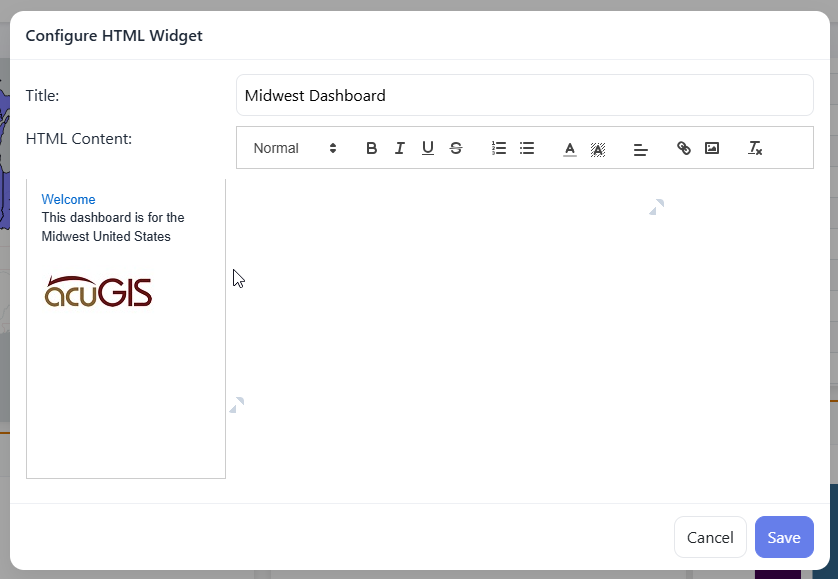
Click save
Your HTML widget has been added
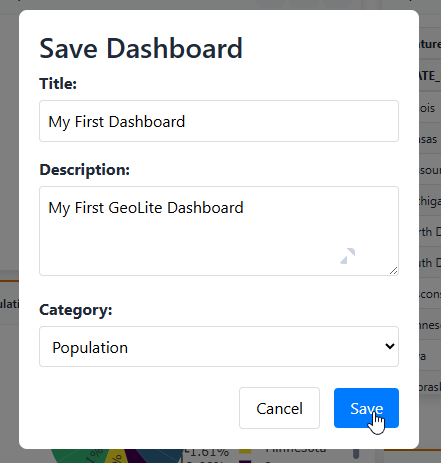
Save Dashboard
When ready click the Save button at top left
Give your Dashboard a Title, Description, and (optionally) select a Category
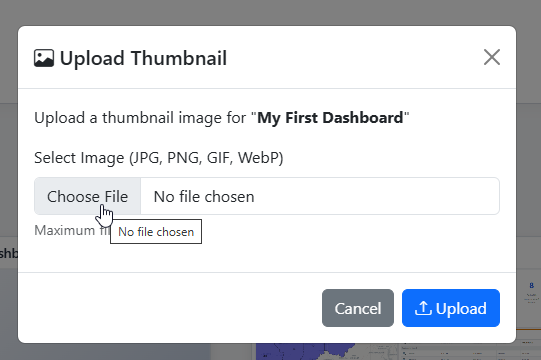
Dashboard Thumbnail
To set a thumbnail for the Dashboard, select Thumbnail on the menu
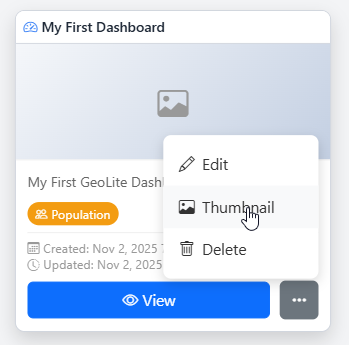
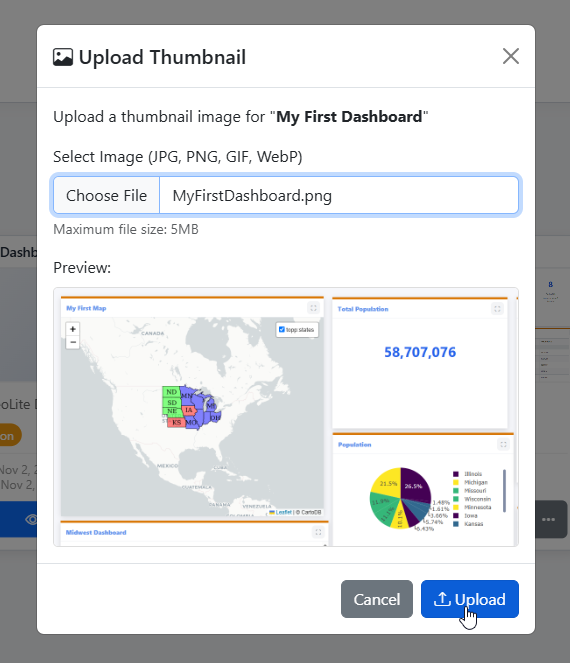
Browse to image you wish to use
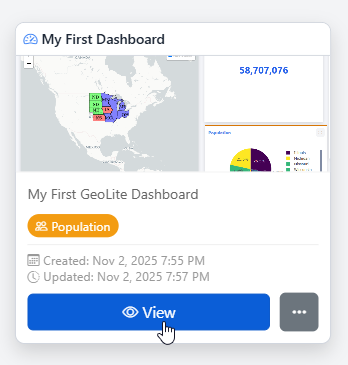
Click Upload
Your thumbnail has now been set
Edit Dashboard
To edit a Dashboard, click the edit link
Make any changes or updates, making sure to click Save as you go
Delete Dashboard
To delete a Map, click the delete icon